Understanding How to Effectively Calculate Standard Deviation in Excel
Calculating the **standard deviation** in Excel is crucial for anyone involved in data analysis. Standard deviation measures the amount of variation or dispersion of a set of values. By understanding how to use Excel’s powerful formulas and functions, you can easily analyze variability within your data sets, helping to make data-driven decisions. This guide will provide a comprehensive look into the process of calculating standard deviation in Excel, along with examples and tips to enhance your data analysis efforts.
What is Standard Deviation?
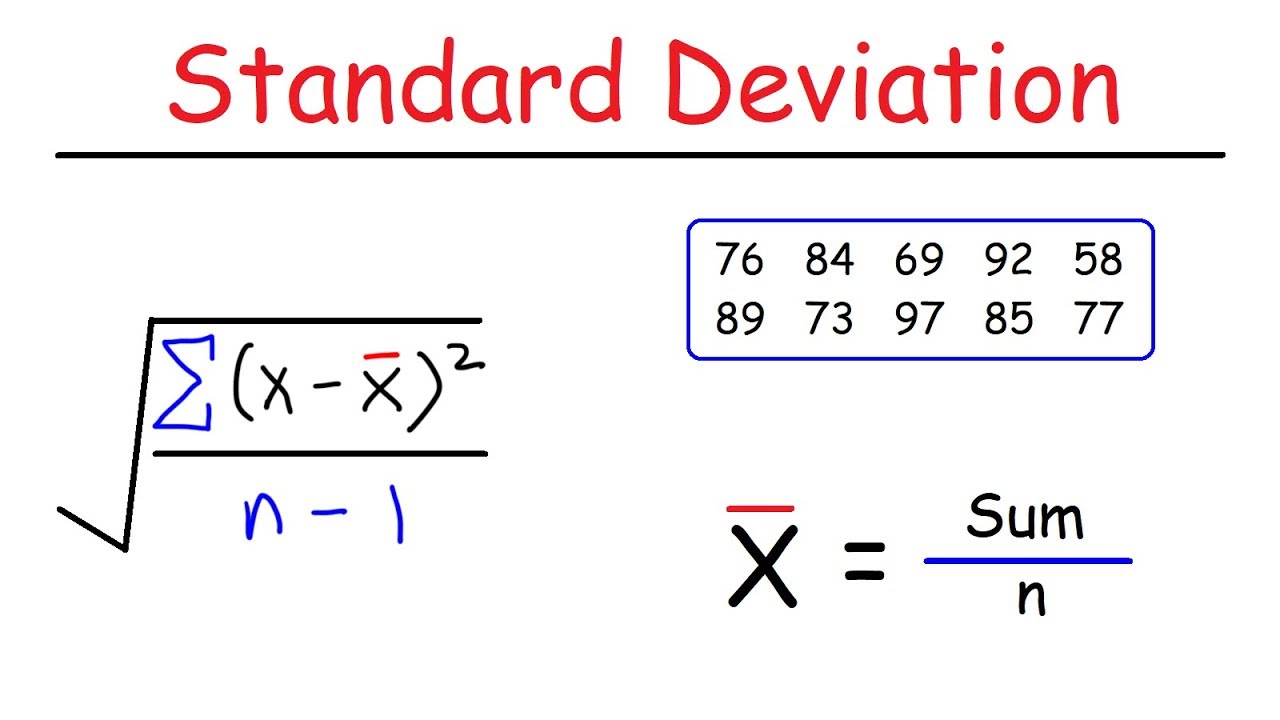
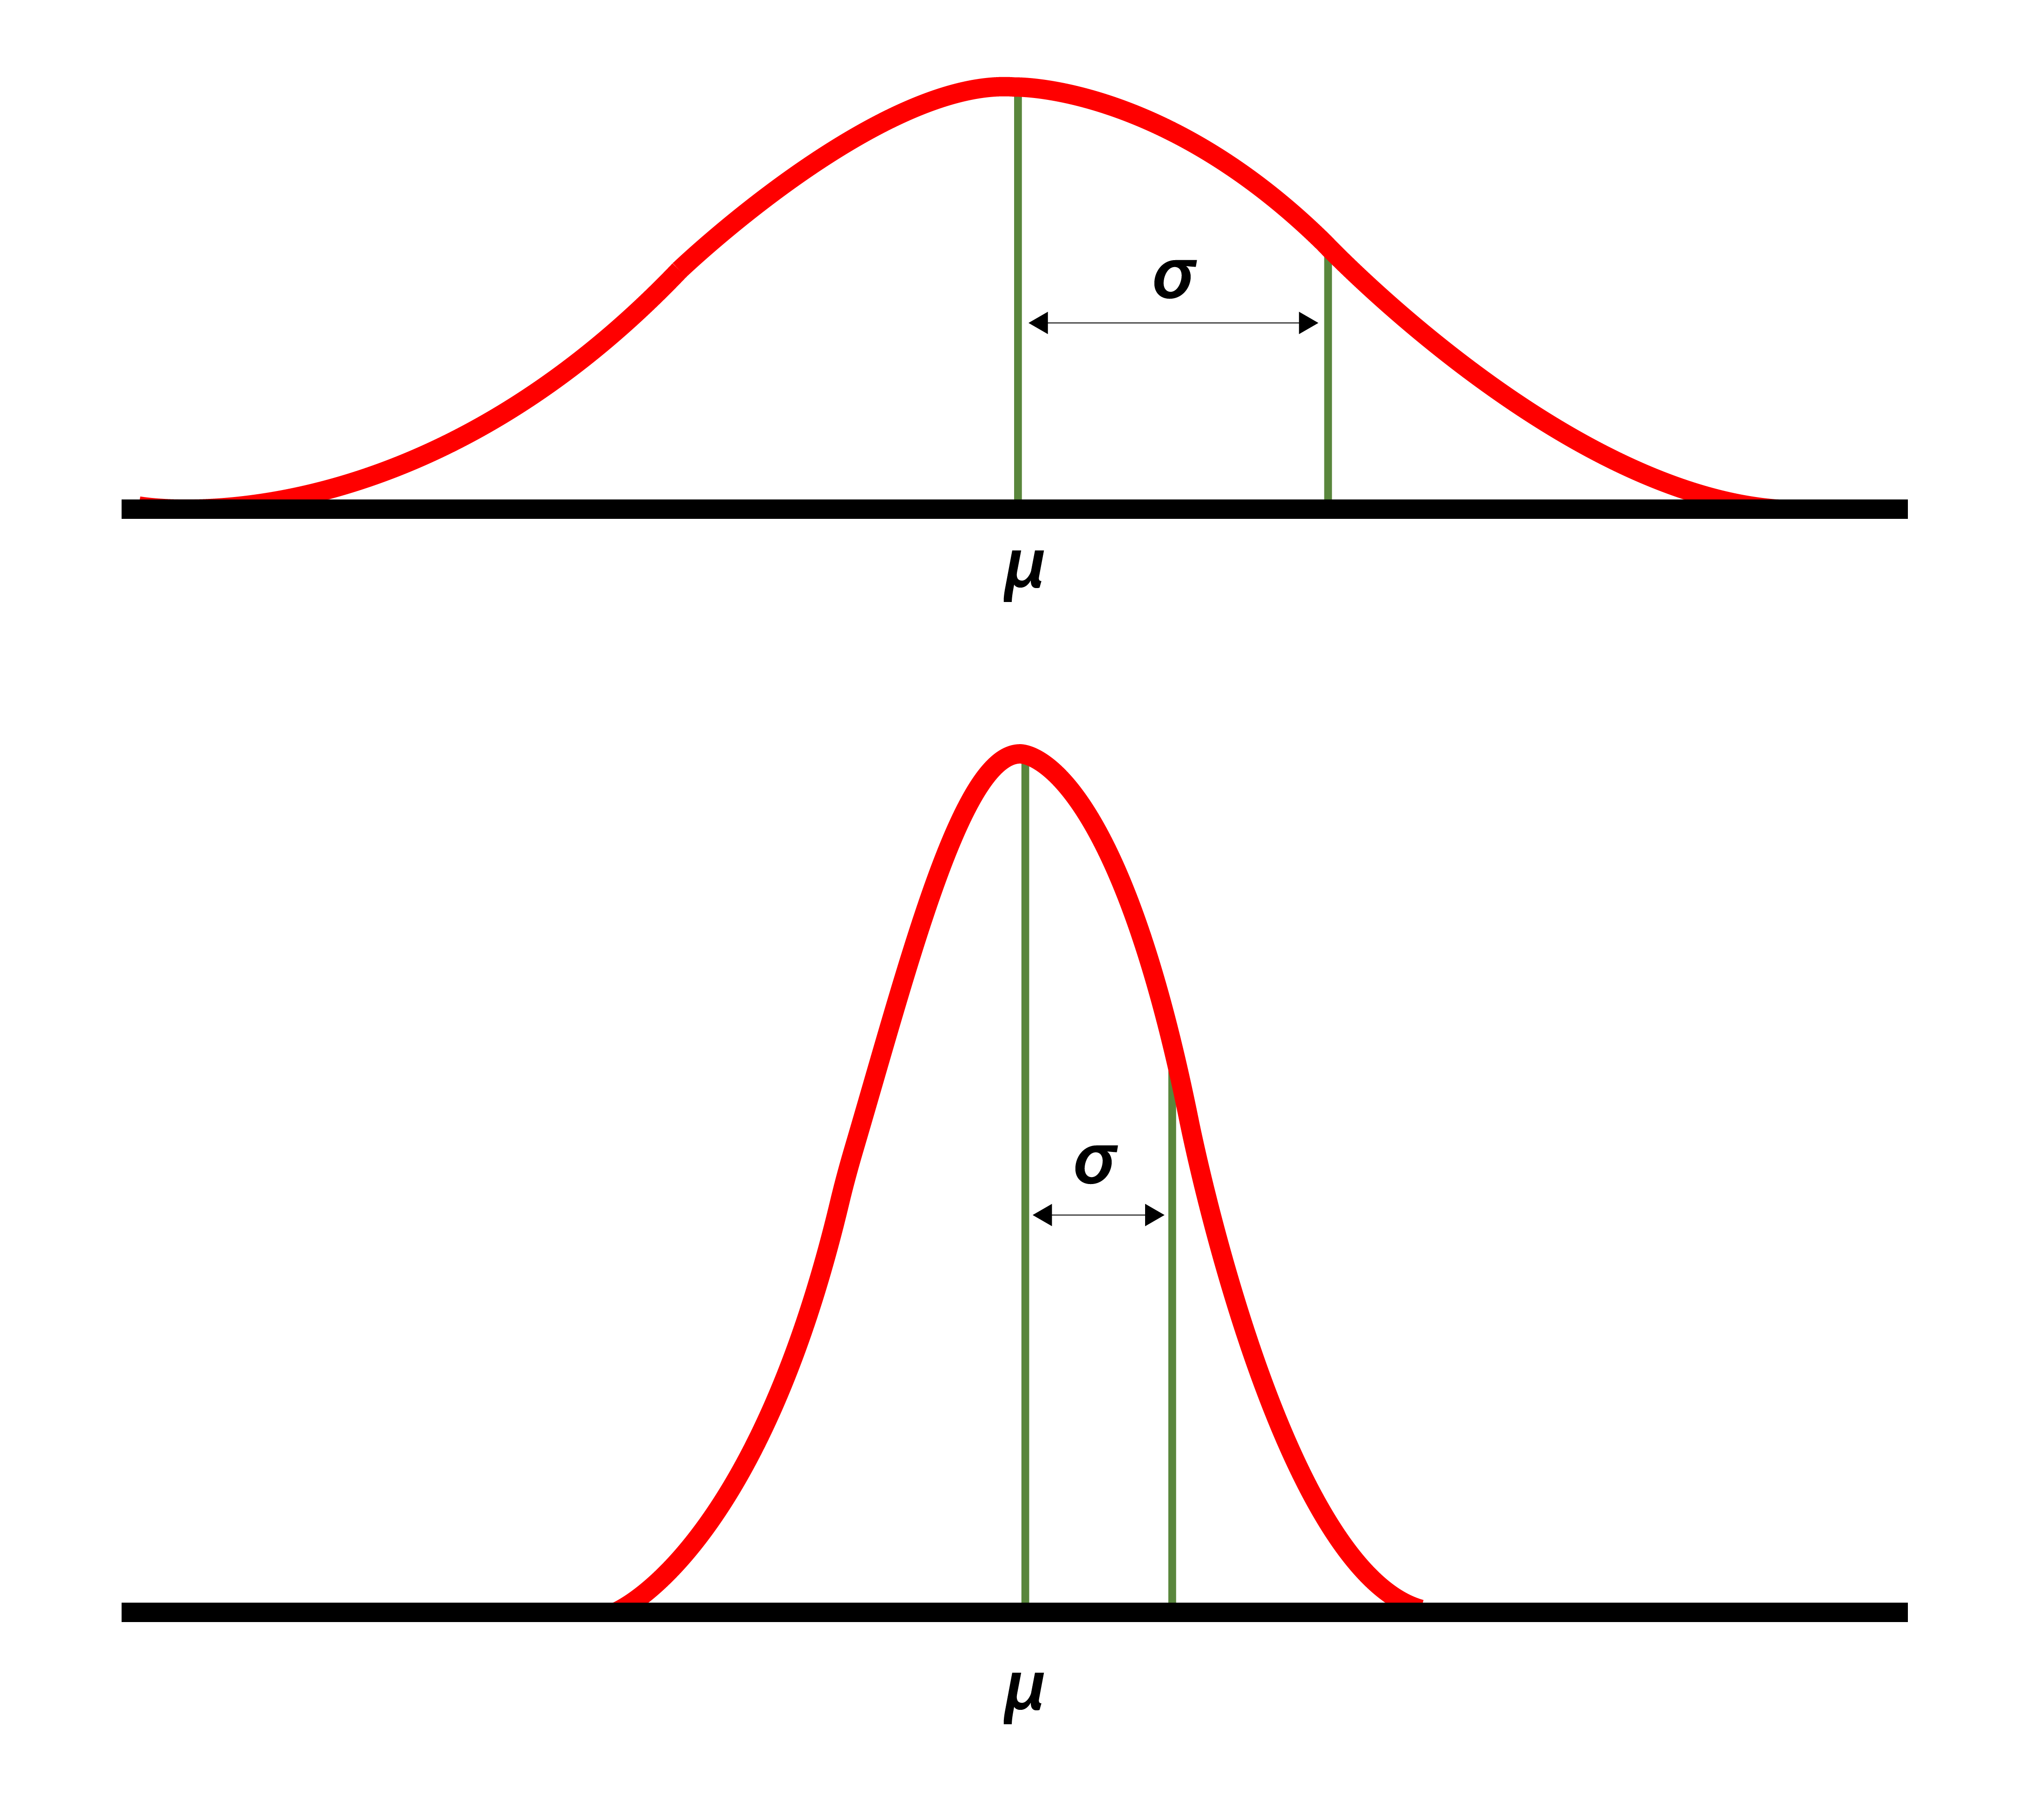
The **standard deviation** is a key statistical metric that describes how spread out numbers are in a data set. In the context of data analysis, it helps quantify the **variability measurement** and is essential for understanding data distribution. When you find the **standard deviation**, you are essentially calculating how much each data point differs from the mean of the data set. A high standard deviation indicates that the data points are more dispersed, while a low standard deviation suggests they are clustered closely around the mean.
Types of Standard Deviation
There are primarily two types of **standard deviation** to consider: the **population standard deviation** and the **sample standard deviation**. The population standard deviation is used when the dataset includes the entire population, while the sample standard deviation is used when your dataset is a subset of the larger population. In Excel, these can be calculated using **STDEV.P** and **STDEV.S** functions, respectively.
Why is Understanding Standard Deviation Important?
Understanding standard deviation is critical for anyone involved in **statistical analysis**. It offers insights into the **data distribution**, enabling you to identify outliers and assess the reliability of your data. Moreover, it serves as a foundation for other statistical concepts, including **regression analysis** and hypothesis testing, which are significant in **data science with Excel**. Without a solid grasp of standard deviation, interpreting results and drawing conclusions from data analysis can be challenging.
How to Calculate Standard Deviation in Excel
Calculating standard deviation in Excel can be accomplished by utilizing the **Excel standard deviation formula** available through several built-in functions. Below are steps to effectively calculate the standard deviation using various methods in Excel.
Using the STDEV Function
The **STDEV** function in Excel is a widely used tool to calculate the standard deviation from a set of values. Simply follow the steps: select the cell where you want the result to appear and type =STDEV(range), where “range” represents the cells containing your data. For instance, if your data is in cells A1 to A10, you would type =STDEV(A1:A10). Press Enter, and Excel will calculate the standard deviation.
Using STDEV.P and STDEV.S Functions
To differentiate between population and sample calculations, Excel provides the **STDEV.P** for population standard deviation and **STDEV.S** for sample standard deviation. If you are analyzing the entire population data, use =STDEV.P(A1:A10), whereas if your data represents a sample, you would use =STDEV.S(A1:A10). Both functions function similarly but apply different calculations based on your dataset context.
Advanced Techniques in Using Standard Deviation
For those familiar with **advanced Excel functions**, there are numerous techniques to analyze data and recognize patterns through standard deviation. More advanced Excel statistical functions often help in interpreting the standard deviation results.
Creating a Data Visualization
Visualizing standard deviation can significantly aid in understanding your data more clearly. Creating a **normal distribution curve** can help depict the data spread around the mean visually. To do this in Excel, you can create a histogram to represent how the data values cluster and identify the **measures of variability**. This also involves overlaying the mean and standard deviation on your histogram for clear representation.
Practical Example: Analyzing Sales Data
Consider a scenario where sales figures for the past 12 months are recorded in an Excel spreadsheet. You can calculate both the sample and population standard deviation to understand the sales variability over time. Using the STDEV.S function for your monthly data can help identify trends in your sales pattern, while the STDEV.P can give you the overall stability of your organization’s sales. Such analysis can drive better business decisions and improvement strategies.
Tips for Efficient Data Analysis in Excel
Working with **Excel for data analysis** necessitates mastering several tips to enhance your efficiency and achieve accurate results.
Utilize Excel’s Data Analysis Toolpak
The Data Analysis ToolPak add-in within Excel is an invaluable resource for performing complex data analysis, including calculating standard deviation. It allows for quick analyses without needing extensive knowledge of statistical formulas. To access it, navigate to the ‘Data’ tab, select ‘Data Analysis,’ and choose “Descriptive Statistics.” From there, you can specify your data range and request the standard deviation output.
Keep your Data Organized
Properly organizing your data sets and using Excel’s **conditional formatting** can help you quickly identify data outliers that affect your standard deviation calculations. By setting rules for cells that contain numbers significantly higher or lower than the mean, you can maintain a meticulous and efficient approach towards **data interpretation methods**.
Key Takeaways
- Standard deviation is critical in assessing the variability of data and understanding data distribution.
- Excel provides multiple functions like STDEV.P and STDEV.S for calculating standard deviation from sets of data.
- Visual representations enhance data analysis, making insights more accessible.
- Utilizing Excel’s Data Analysis Toolpak can streamline the process of calculating the standard deviation.
- Keeping data organized allows for easier handling and clearer insights.
FAQ
1. What is the difference between STDEV.P and STDEV.S in Excel?
The STDEV.P function calculates the standard deviation based on the entire population, while STDEV.S assesses it based on a sample of that population. Choosing the right function depends on whether your data set represents all members or just a portion of it.
2. How can I visualize standard deviation in Excel?
You can visualize standard deviation by creating histograms or using scatter plots overlaid with lines representing the mean and standard deviation. This depicts how data points are spread and can make complex data easier to interpret.
3. Can I calculate standard deviation for multiple datasets in Excel?
Yes, by employing Excel’s functions, you can calculate standard deviation for multiple datasets by applying the STDEV functions to different ranges. You can even create a summary report for quick insights.
4. What are common mistakes when calculating standard deviation in Excel?
Common mistakes include using the wrong function (STDEV vs. STDEV.P/S), improper data ranges, and neglecting to check for outliers before calculation. Always ensure your data is clean and that the appropriate formula fits your analysis.
5. How can I improve my data analysis skills in Excel?
Improving your Excel data analysis skills involves practice with various functions, using Excel tutorials, and exploring data visualization tools. Consider working on complex datasets and leveraging online resources for guided learning.
6. Are there shortcuts for calculating standard deviation in Excel?
You can use keyboard shortcuts or custom snippets saved in Excel to speed up calculations. Additionally, familiarizing yourself with the function’s syntax will streamline your work process.
7. What should I do if I encounter errors in my standard deviation calculations?
Errors can arise from non-numeric data in your selected range or incorrect function usage. Ensure your data range is complete and controlled for type errors. Check your formula for accuracy before calculating.