
“`html
Essential Guide to Understanding Standard Deviation and Its Importance in Statistics
Understanding standard deviation is crucial for anyone working with data, whether you’re in finance, education, or research. This comprehensive guide explains **how to interpret standard deviation**, its significance, and practical applications across various fields. By the end of this article, you will have a solid grasp of standard deviation and its role in data analysis.
What is Standard Deviation?
**Standard deviation**, often denoted as SD, is a statistical measure that quantifies the amount of variation or dispersion in a dataset. A low standard deviation indicates that data points tend to be close to the mean (average) value of the dataset, while a high standard deviation signifies that data points are spread out over a wider range of values. It’s a vital part of descriptive statistics used to assess the extent of variability within the data, making it an essential tool for researchers and analysts alike.
Standard Deviation Formula
The formula for standard deviation is expressed differently for populations and samples. For a population, it is defined as:
\[\sigma = \sqrt{\frac{1}{N} \sum_{i=1}^{N} (x_i – \mu)^2}\]
Where:
– \(\sigma\) = population standard deviation
– \(N\) = number of data points in the population
– \(x_i\) = each data point
– \(\mu\) = mean of the population data
For a sample, the standard deviation formula uses \(n – 1\) (Bessel’s correction) in the denominator to account for bias:
\[\text{s} = \sqrt{\frac{1}{n-1} \sum_{i=1}^{n} (x_i – \bar{x})^2}\]
Where:
– \(s\) = sample standard deviation
– \(n\) = number of data points in the sample
– \(\bar{x}\) = mean of the sample data
These formulas are foundational for correctly **calculating standard deviation** and should be understood thoroughly for accurate data representation.
Significance of Standard Deviation in Data Analysis
Understanding standard deviation is essential for interpreting results in a wide array of disciplines, including finance and research. It helps analysts determine the **significance of standard deviation** in relation to the data’s overall performance. For instance, a tight group of investment return data around the mean suggests low risk, while a wider spread indicates higher volatility. This makes understanding how to communicate risk effectively crucial for investors and decision-makers who rely on variability to forecast future trends.
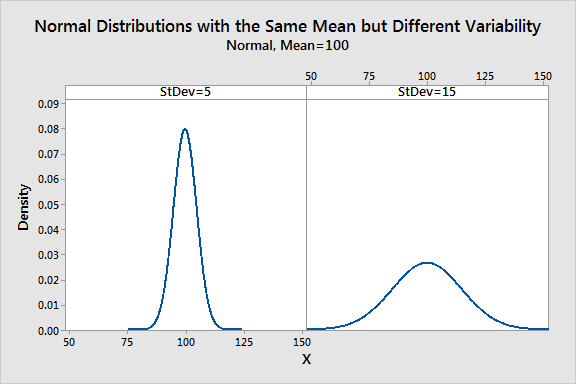
Visualizing Standard Deviation
**Visualizing standard deviation** often involves graphical representations, such as bell curves, where the standard deviation aids in illustrating data distribution. In a normal distribution, about 68% of data falls within one standard deviation of the mean, 95% within two, and 99.7% within three. Understanding this distribution can help researchers and data analysts contextualize their findings by measuring how much data diverges from the average. Additionally, visual aids enhance comprehension which is pivotal when conveying complex concepts. Here is an image that highlights how to interpret standard deviation:
Interpreting Standard Deviation in Statistics
When **interpreting standard deviation in statistics**, it is crucial to consider the dataset’s context. For example, in standardized testing, a SD of 10 points can signify different levels of performance depending on the score’s mean. A mean score of 50 with a standard deviation of 10 means that most students score between 40 and 60, indicating a class capable of performing consistently. Conversely, a higher standard deviation could indicate a more diverse range of scores reflecting varying student abilities. Thus, correctly interpreting standard deviation helps in making informed decisions and drawing accurate conclusions from data.
Standard Deviation Versus Variance
**Standard deviation versus variance** is a comparison that often arises in statistics discussions. Although they both measure data variability, variance is the average of squared deviations from the mean, while standard deviation is the square root of that variance. This means standard deviation provides a measure of variability in the original units of measurement, making it more interpretable compared to variance. Understanding the distinction is important because it aids in thoroughly assessing data distribution without losing sight of practical implications in real-world applications.
Standard Deviation in Real Life
One of the critical aspects of **standard deviation in real life** is its application in various sectors, including finance, education, and quality control. For instance, in finance, standard deviation is essential for assessing investment risk. Assets with higher standard deviation are considered riskier because their returns can vary significantly from the mean, guiding shareholders in their decision-making processes. By employing standard deviation, practitioners can devise strategies that align risk with expected returns, exemplifying its real-world utility.
Practical Examples of Standard Deviation
To illustrate, consider a scenario where a company’s monthly sales figures fluctuate. If the sales for the last six months were $1000, $1500, $1800, $2000, $2400, and $900, calculating the standard deviation would reveal how stable or erratic the company’s sales results are. Here’s a brief step-by-step guide on calculating the standard deviation using this dataset:
1. **Find the mean**: $1000 + $1500 + $1800 + $2000 + $2400 + $900 = $10600, then divide by 6 to get the mean ($1766.67).
2. **Find the deviation for each data point and square it**:
– ($1000 – $1766.67)² = $585.13
– ($1500 – $1766.67)² = $111.11
– …continue for each value.
3. **Calculate the average of the squared deviations and then take the square root.**
This straightforward approach demonstrates the significance and practicality of integrating standard deviation in **data analysis**.
Implications of Standard Deviation in Quality Control
In **quality control**, standard deviation plays a pivotal role in ensuring product consistency. By analyzing the variability of product dimensions, a manufacturer can maintain high-quality standards and adhere to production specifications. Consistently low standard deviations imply rigorous production processes can identify outliers or defective products early in the production chain. Therefore, understanding standard deviation equips businesses with the tools needed for ongoing quality improvement and customer satisfaction.
Key Takeaways
- Standard deviation quantifies the variability of a dataset and is crucial for effective data analysis.
- The formula for calculating standard deviation varies depending on whether you are working with a sample or a population.
- Visualization aids in better understanding and interpreting standard deviation within various contexts.
- Standard deviation has significant real-life applications, particularly in financial risk assessment and quality control.
- Employing practical examples and case studies reinforces comprehension and facilitates better learning.
FAQ
1. What is the meaning of standard deviation in statistics?
**Standard deviation meaning** refers to the statistical measure that indicates the extent to which individual data points in a dataset differ from the mean. It is pivotal in evaluating data consistency, enabling analysts and researchers to visualize and understand data variability more effectively.
2. How do you interpret standard deviation and variance?
While **interpreting standard deviation**, it’s essential to understand that standard deviation provides a tangible measure (units of the variable) of how spread out the data is. In contrast, variance, which is the average of the squared deviations from the mean, is in squared units of the original data points. Recognizing the difference helps to interpret results accurately.
3. When should you use standard deviation in data analysis?
Using standard deviation is crucial when analyzing data sets with variable outcomes. In scenarios where understanding the risk and variability of data is important, like in finance or quality management, applying standard deviation significantly enhances decision-making processes.
4. What are common misconceptions about standard deviation?
One **common misconception about standard deviation** is that a small standard deviation signifies a good dataset. While it indicates data is clustered closely around the mean, it doesn’t necessarily reflect the dataset’s relevance or importance. Analysts must look at the bigger picture, including the dataset’s context, before making conclusions.
5. How is standard deviation used in exploratory data analysis (EDA)?
In **exploratory data analysis techniques**, standard deviation is implemented to assess the dispersion of variables, allowing analysts to understand relationships in datasets better. High standard deviation may signal the need to explore further or reevaluate data integrity, helping to uncover insightful information.
“`